March 31st, 2025
Studio
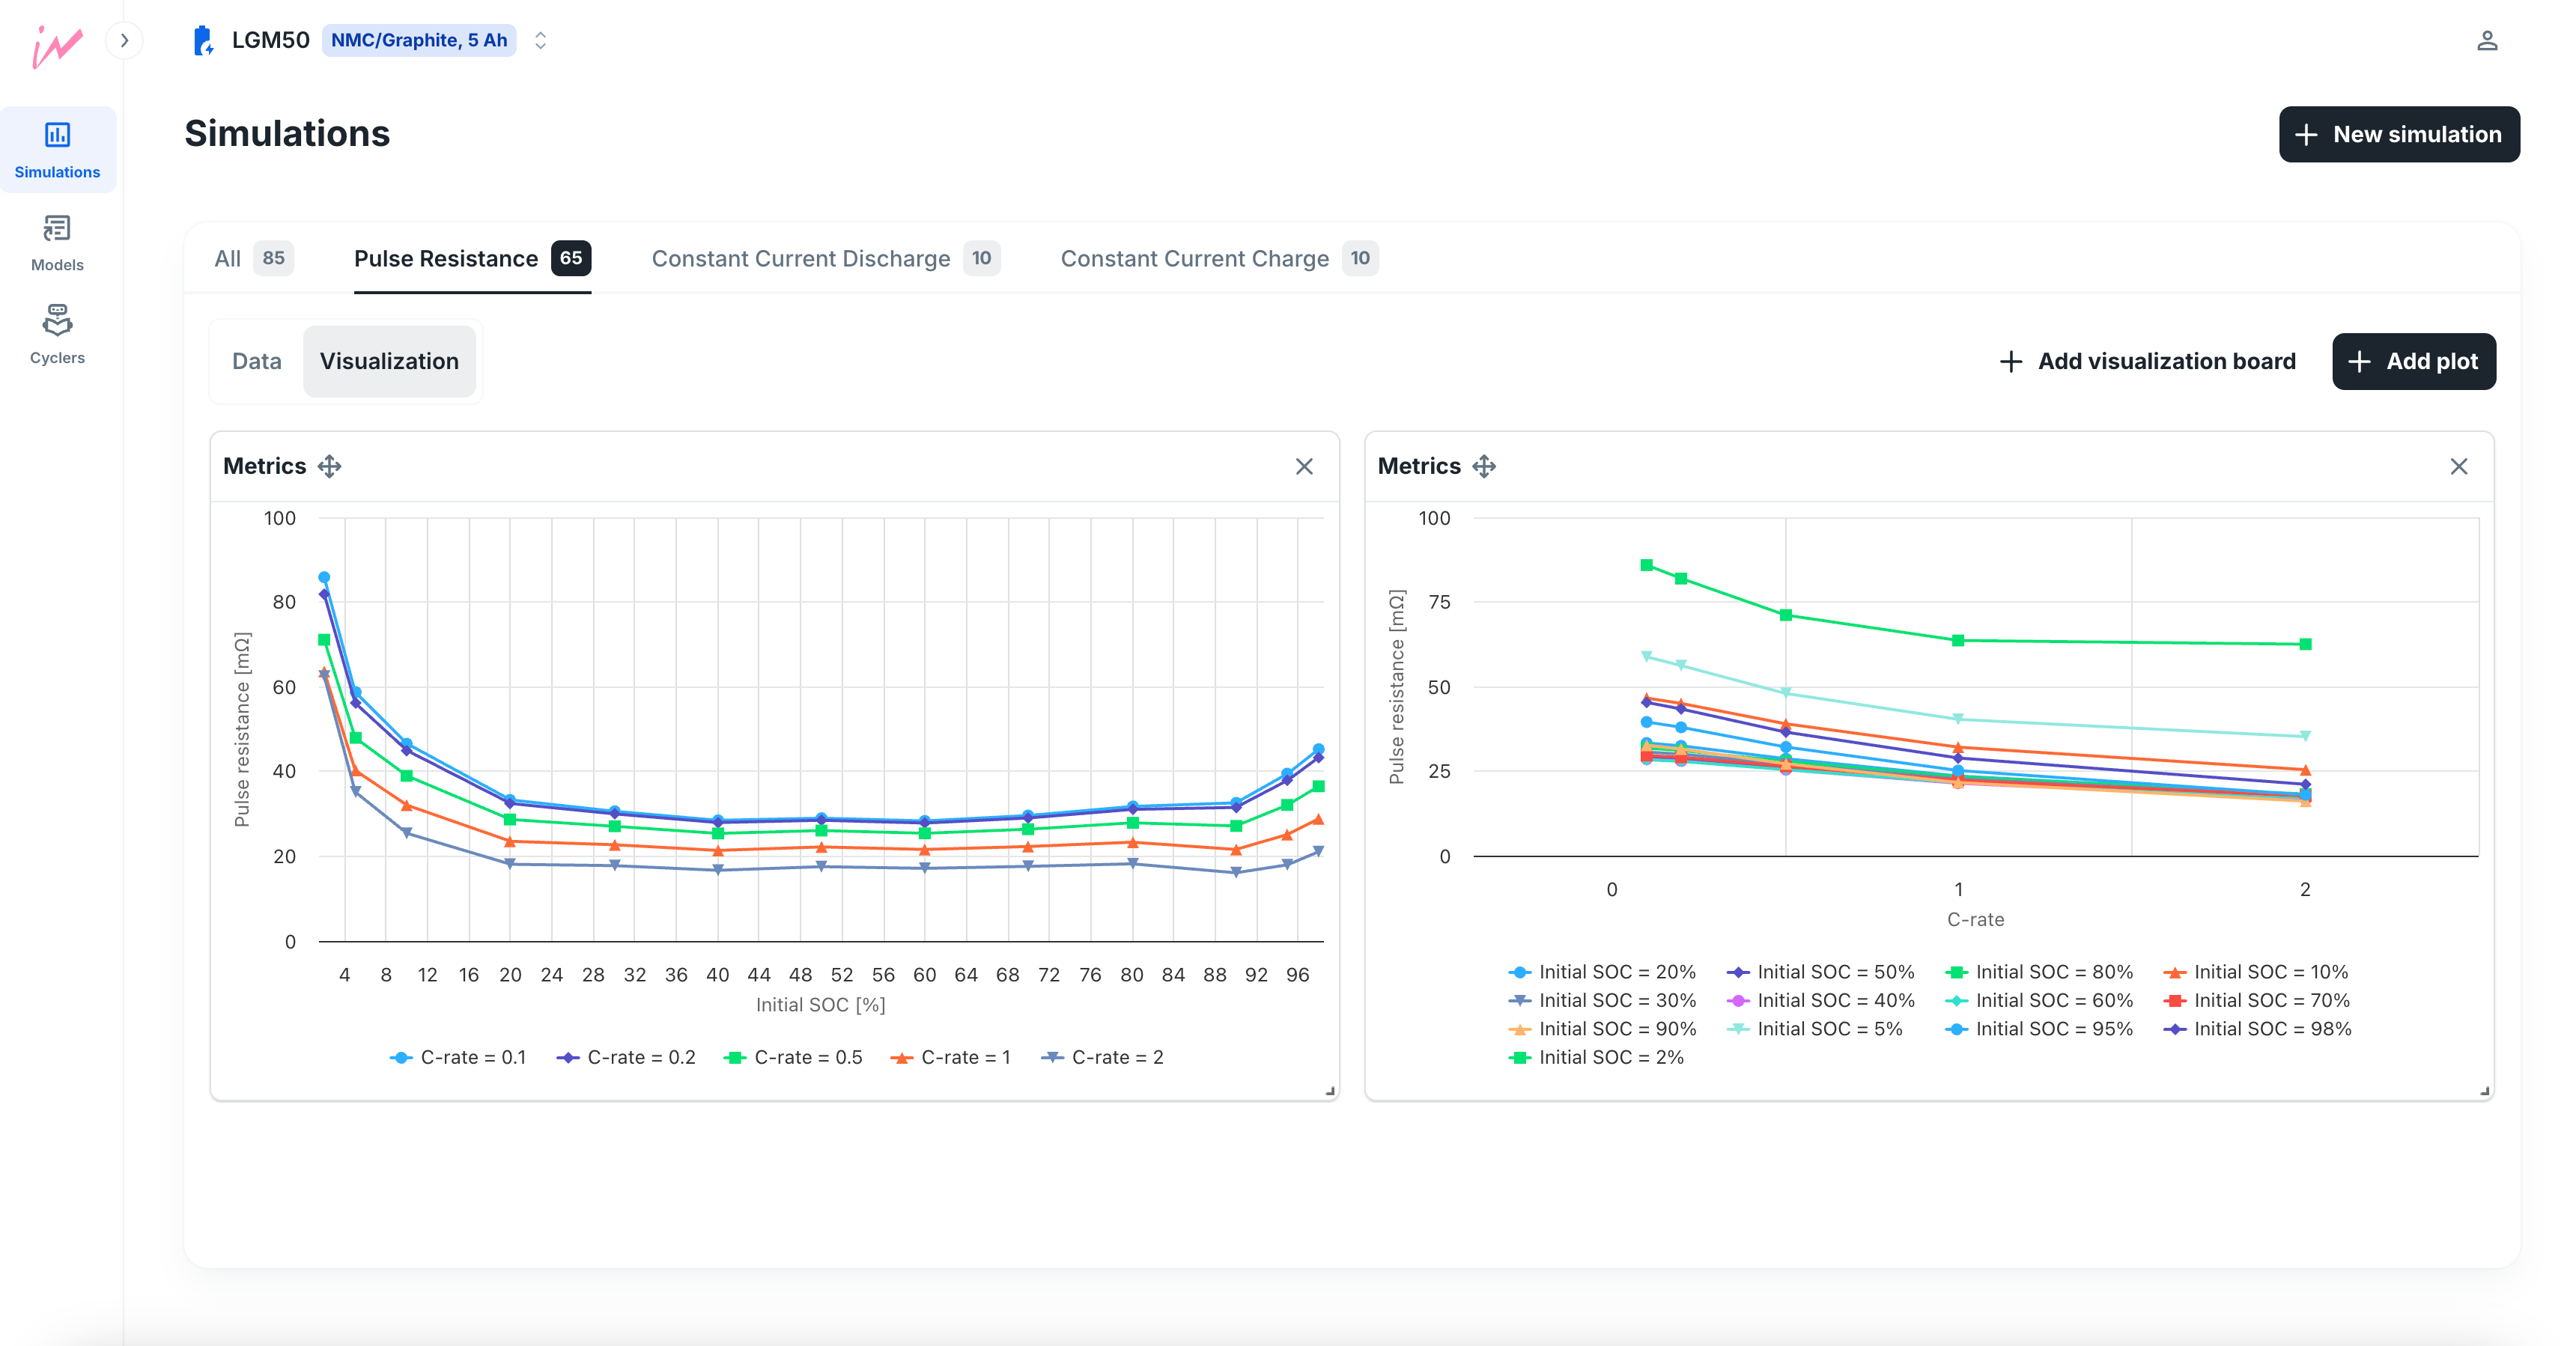
New Simulation Dashboard
We’ve just launched a redesigned Simulation Dashboard, making it easier than ever to explore and visualize your simulation results. Whether you’re comparing dozens of runs or diving deep into one, the new dashboard adapts to your workflow.
Key Features:
Resizable & Reorderable Plots: Customize your layout to focus on what matters most.
Multiple Dashboards per Dataset: Create different views for different questions—no need to rerun simulations.
Smart Filtering: Set filters for each plot so new simulations that match your criteria are automatically included—no manual updates needed.
This upgrade builds on all the existing plotting functionality you’re used to:
Flexible Plotting: Visualize time series variables or aggregated metrics with ease.
Overlays Made Easy: Compare multiple simulations on a single plot with automatic labeling.
Whether you're running 1 or 100 simulations, your data just got a whole lot easier to navigate.